


To investors,
Will Clemente breaks down this week’s bitcoin situation using on-chain metrics to separate the signal from the noise. You can follow Will on Twitter or sign up for his email by clicking here. Here is Will’s analysis:
Hope all is well, and you had a great week. This was an interesting week in terms of price, with BTC dipping below 30K, retracing all the gains from 2021. Since then, we’ve rallied back above the short term hourly downtrend and retested that trend as support at the time of writing ($35,118). Despite price fluctuations, not much has changed in terms of on-chain structure from last week. Mostly seeing continuation of trends in investor behavior we have already been following. Let’s dive in.

From a high level, here are some of the key takeaways this week:
Long-Term Holder buying offset selling from Short-Term by 21,136 BTC this week
Miners selling, Hash rate down
“W” shaped recovery in new users coming on the network
Still a lack of new whales coming on the network
Stablecoins rotating back in from the sidelines
Supply continues to rotate into entities with little history of selling (illiquid entities)
OTC Desk Flows are bullish, while exchange flows slightly bearish (up ~10K BTC this week)
Accumulation from strong-hands and experienced market participants has continued. The illiquid supply change metric, also dubbed the “Rick Astley Indicator” by Willy Woo, is still continuing its trend of strong accumulation from entities that statistically have a very low likelihood of selling. For weeks now, we’ve been watching the reversal of the drawdown this metric has had during the original price drawdown that dropped us into this current 30K-40K range. When we looked at this metric last week, we only had 3 days in the green and they weren’t large bars, however this week we’ve gotten strong confirmation of the positive trend with 7 straight fairly large green days; with the 30 day change of liquid to illiquid supply reaching as high as 95,800 BTC on Monday.

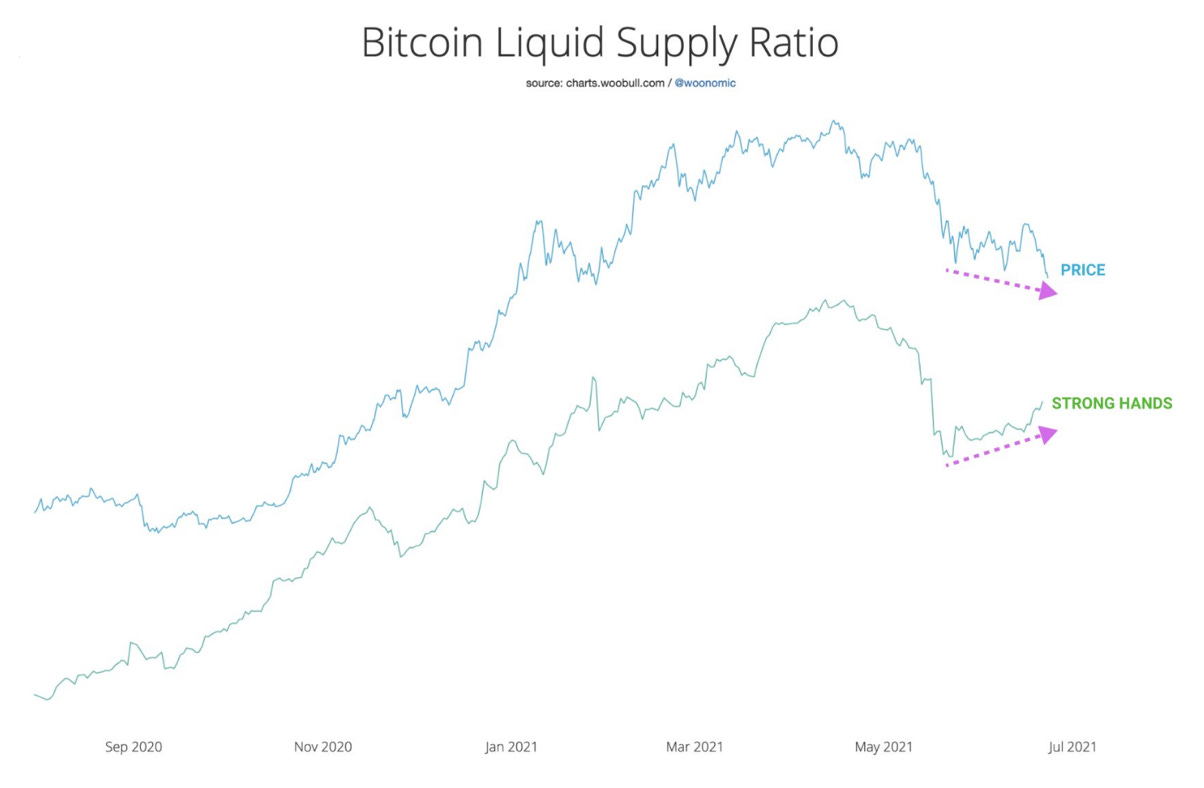
As a variant of this, I introduced an idea to Willy Woo of comparing liquid to liquid supply in a simple ratio. This ratio is very similar to the metric above, essentially describing the same thing, but is just a trendline of this simple ratio. Willy charted out the ratio for me and noticed something very interesting. What he noticed was a clear bullish divergence (when an oscillator makes a higher low, but price makes lower low) in the ratio. The last time we had a divergence this clear in the ratio was during the recovery from the correction in late January earlier this year. This supports the idea of re-accumulation we’ve been talking about heavily. Simplified, the trend of strong hands buying is increasing as price is decreasing.
By the way, yes, selling is still coming from young entities. I think this point has been made in this newsletter for well over a month now, but all indication of the age of coins being sold on-chain are still trending down. This week, long-term holders buying is now offsetting selling from short-term holders in a big way, with LTHs adding 21,136 more BTC to their holdings than STHs have reduced their holdings by.
In the last week LTHs have added 120,739 BTC while STHs have reduced their holdings by 97,333 BTC. To be noted: some of this is STH entities aging into the LTH cohort that bought Bitcoin around late January (155 day cutoff). This divergence between the two in the chart below can be interpreted differently depending on your view of market structure based on other things; it resembles what occurs both at the tail end of a bull market, but also what occurred in the middle of both previous bull markets. What you see is this large divergence between the 2013 “double pumps”, as well as a more moderate, but still noticeable divergence in late 2016. This essentially means that experienced were setting the floor for bull run continuation. I highly suspect this is what is going on now, when combined with other broader metrics that are not signaling Bitcoin being in a bear market.

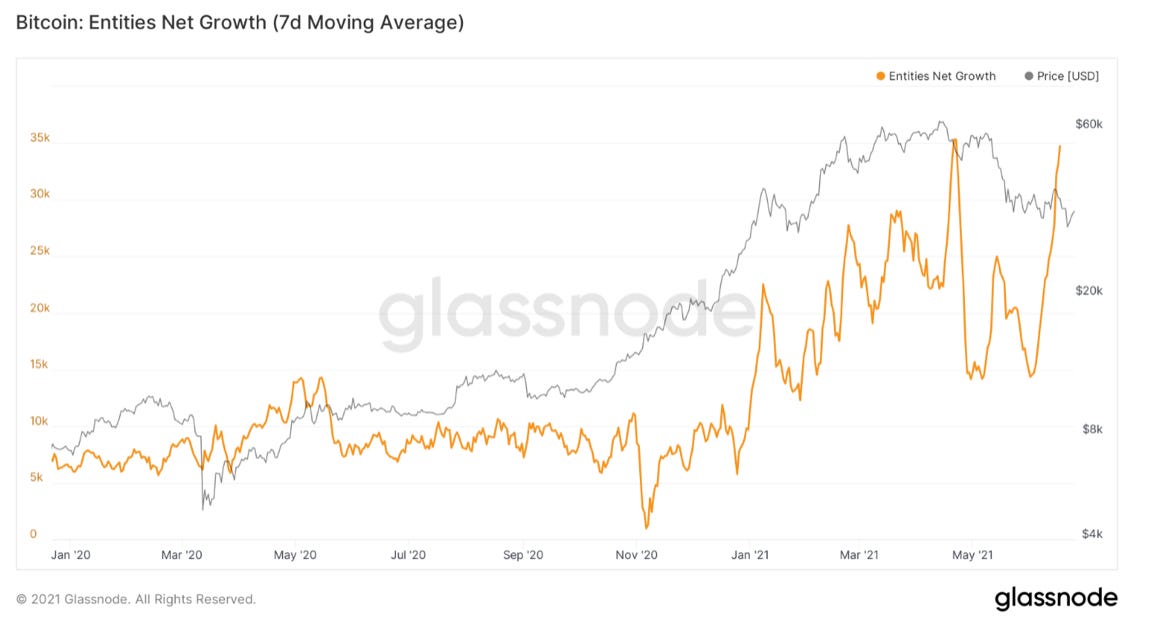
Although the number of new whales (entities holding over 1,000 BTC) is still flat, which is something I think is crucial to see for big a continuation of the bull market, the number of new entities coming on the network overall is showing a very nice W shaped recovery. I would be very curious to see how many of these new users are coming from Latin America. Nonetheless, this uptick is not resemblance of what occurred at the tail end of any previous bull market.
Next up we have SOPR, something I believe we’ve touched on every week; a metric that looks at the profit taking of coins trading on any given day. Similar to the liquid supply ratio, this is showing a clear bullish divergence. To me this indicates that any strong capitulation that was going to be done has already taken place and that the panic behavior and willingness to sell at a loss is dissipating. This is the clearest bull div that I’ve seen in this indicator since late January. Coincidentally (or not) this was the same case with the bull div in the liquid supply ratio, hmm…

Next up we have a new metric Glassnode released, the stablecoin supply ratio oscillator. This shows that capital in the form of stablecoins is slowly rotating back into the market from the sidelines. This chart (labelled in a tweet from Glassnode) shows that the current recovery in terms of stable coin flows resembles that of previous major corrections such as late 2018, March 2020, and the relatively big drawdown during September of last year.

The crackdown on miners in China is real and visible on chain. Firstly, obviously hash rate has dropped tremendously. But from a selling pressure perspective, miners are slightly reducing their holdings. This is shown by miner net position change. However, this selling pressure does not appear to be anything very significant. All in all, miners have reduced their holdings by 5,125 BTC since the end of May according to Glassnode’s “miner balance” metric.

Lastly, I wanted to shill another new metric that I created, titled: OTC Desk Outflow Stoch RSI Signal. (I need to come up with a shorter name) This looks at the strength of which the trend of OTC outflows are occurring. This of course is tracking behavior of big money; high net worth individuals and institutional players that navigate through OTC desks. This capital is what of course drives the market; therefore, following the movement of this capital offers insightful signal to market structure.
When the RSI breaks out of the purple highlighted range, it offers buy/sell signals. When below, sell signals (lack of OTC outflows) and conversely when above, buy signals (large amount of OTC outflows). Over the last year, these signals have been correct at a rate over 90%. We just flashed a buy signal, meaning OTC outflows have ramped up. (Big money buying the dip) Note before we had mentioned a lack of new whales, so this shows the “big money” behind these outflows is not new entities, but rather market participants that have already been in this market.

Hope you guys enjoyed this week’s letter, looking forward to touching base next week. Have a good weekend, cheers!
That is it for today’s analysis. Hopefully you found this helpful. I highly suggest you subscribe to Will Clemente’s email where he breaks down on-chain metrics multiple times per week: Click here
SPONSORED: Amber Group is a leading global crypto finance service provider operating around the world and around the clock with a presence in Hong Kong, Taipei, Seoul, and Vancouver. Founded in 2017, Amber Group is committed to combining best-in-class technology with sophisticated quantitative research to offer clients a streamlined crypto finance experience.
The platform now services over 500 institutions and 100,000+ individual investors across the Amber Pro web platform, the Amber App, as well as their 24/7 trading desk. To date, Amber Group has cumulatively traded more than $330 billion across 100+ electronic exchanges, exceeding $1 billion in assets under management. In 2019, Amber Group raised $28 million in Series A funding led by global crypto heavyweights Paradigm and Pantera Capital, with participation from Polychain Capital, Dragonfly Capital, Blockchain.com.
Click here to sign up now.


Share this post